
In a world where first responders are typically hailed as heroes, a shocking incident in a quiet suburban town has turned that narrative on its head. The story involves a 23-year-old lifeguard, a 5-year-old boy, a near-fatal tragedy, and a legal decision that has left the community—and the internet—completely divided.
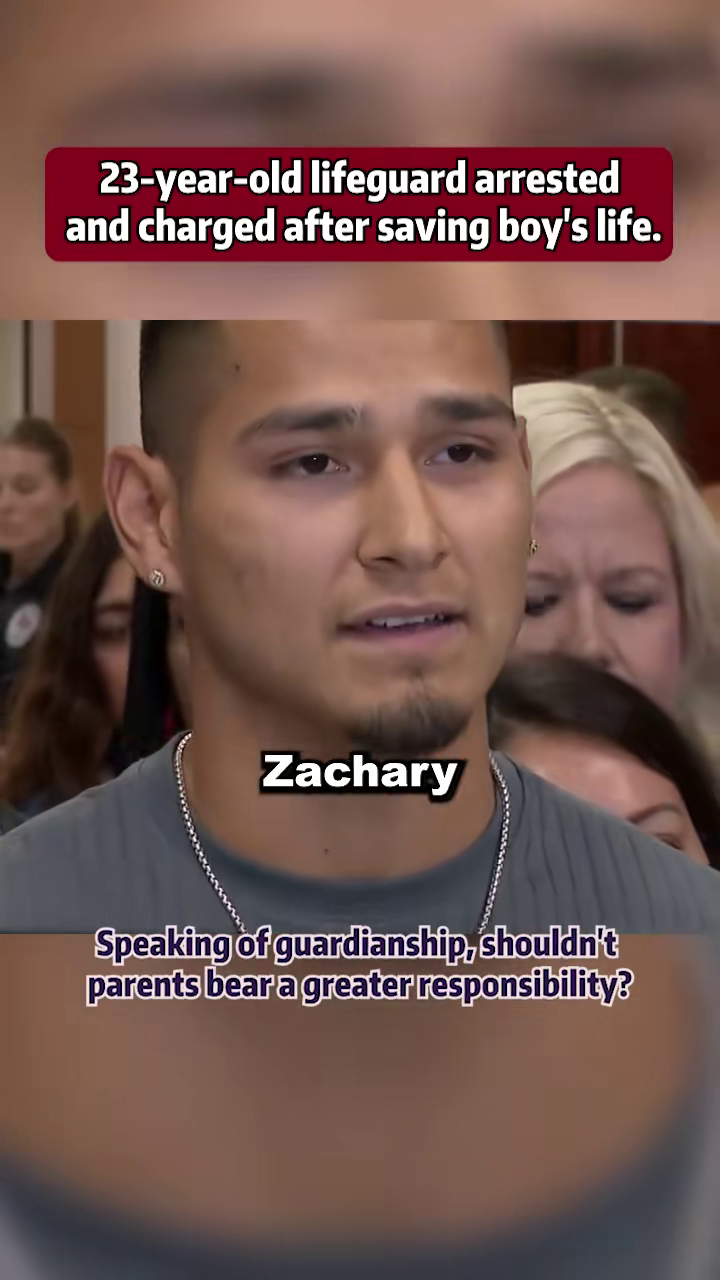
Zachary Stein, a dedicated lifeguard with five years of experience, did what he was trained to do: he jumped into the water, pulled a lifeless body to the surface, and performed CPR until the child breathed again. By all traditional metrics, Zachary is a hero. He prevented a funeral. He returned a child to his parents.
However, instead of receiving a medal or a key to the city, Zachary received a pair of handcuffs. In a move that has sparked fierce debate regarding liability, duty, and parental supervision, the police arrested Stein, charging him with reckless endangerment and risk of injury to a minor.
The question burning through social media and legal forums alike is simple yet terrifying: Can you be criminally charged for saving a life if the authorities decide you didn’t save it fast enough?
The Incident at the Pool
It was a typical summer day at the local park splash pool. Families were gathered to beat the heat, and the atmosphere was filled with the sounds of splashing water and playing children. Manning the chair was Zachary Stein, a 23-year-old who had made lifeguarding his full-time profession for the last half-decade. He was not a rookie; he knew the protocols, and he knew the risks.
Among the swimmers was 5-year-old Adam. Like many children his age, the water was a place of excitement but also immense danger.
Surveillance footage, which would later become the centerpiece of the prosecution’s case, captured the harrowing moments. Adam ventured into water that was too deep for his swimming abilities. The footage shows the boy struggling. He bobs up and down, unable to keep his head above the surface consistently.
This is where the narrative splits into two furious sides. To the untrained eye, a drowning child splashes and yells. But experts know that drowning is often a silent event. There is no yelling because the victim is trying to breathe. There is no waving because the arms are instinctively pushing down to lift the head.
Adam eventually slipped beneath the surface.
The Rescue and The Revival
According to the police report and the time-stamped video surveillance, Adam was underwater for a significant amount of time. When Zachary Stein realized the severity of the situation, he did not hesitate. He abandoned his post, dove into the water, and retrieved the boy.
At this point, the situation was critical. Adam was unresponsive. He was not breathing. The terrifying reality of a potential fatality hung heavy over the pool deck.
Stein immediately initiated CPR protocols. He worked on the small boy, applying chest compressions and rescue breaths. It is a traumatic experience for any first responder, let alone a young lifeguard. The moments ticked by, agonizingly slow for the onlookers.
Then, a miracle. Adam’s pulse returned. He began to breathe. Stein had successfully revived the child. The ambulance arrived, and Adam was rushed to the hospital. While the boy faced a difficult recovery, he was alive. The immediate threat of d@ath had been thwarted by Stein’s intervention.
Most would assume the story ends there: a close call, a grateful family, and a shaken but proud lifeguard.
The Police Investigation
While Adam was recovering in the hospital, the local police department began reviewing the security tapes from the pool complex. What they saw led them to a conclusion that shocked the community.
Police investigators claim that the footage shows Adam struggling and then submerged for nearly four minutes before Stein took action.
“There were fewer than eight other kids in the pool,” a police spokesperson noted during a press briefing. “Zachary was the only lifeguard on duty. There were no obstructions.”
The authorities emphasized that Stein was not distracted by a cellphone or talking to friends—common reasons for lifeguard negligence. He was in the chair, looking at the pool. The prosecution’s argument hinges on the belief that a trained professional should have noticed a distress signal sooner than four minutes.
They argued that the delay in reaction was not just a mistake, but criminal negligence. They alleged that Stein’s failure to scan his zone effectively amounted to “reckless endangerment,” a charge usually reserved for drunk drivers or individuals who fire weapons in public spaces.
The Charges: Reckless Endangerment
Stein was taken into custody and booked. The charges were serious:
-
Reckless Endangerment in the First Degree: A charge implying that his conduct created a grave risk of d@ath to another person.
-
Risk of Injury to a Minor: A charge often associated with child neglect or abvse.
The legal threshold for these charges is high. The prosecution must prove that Stein showed an “extreme indifference to human life.” This is the point of contention that has legal experts baffled. Can a man who performs CPR and saves a life be accused of being indifferent to it?
Stein’s legal team and supporters argue that “scanning” a pool is subjective. Glare on the water, the refractory nature of light, and the deceptive calmness of a drowning body can make spotting a victim incredibly difficult, even for the most diligent professionals.
Furthermore, “secondary drowning” or delayed dry drowning creates confusion. Did the boy look like he was playing underwater? Was he holding his breath? These are split-second judgments that lifeguards make hundreds of times a day.
The “Guardian” Debate: Where Were the Parents?
Perhaps the most explosive element of this story is the discussion surrounding parental responsibility. As news of Stein’s arrest went viral, the comment sections of news sites were flooded with a singular question: Where were Adam’s parents?
Lifeguards are trained to enforce rules and perform rescues, but they are not babysitters. Most pool safety guidelines explicitly state that parents of young children—especially those as young as five—must remain within arm’s reach or at least maintain constant visual contact.
If the child was struggling for nearly four minutes, as the police claim, why did no family member notice?
“Speaking of guardianship,” one viral comment read, “shouldn’t parents bear a greater responsibility?”
Critics of the arrest argue that charging the lifeguard sets a dangerous precedent. It shifts the burden of 100% of the safety monitoring onto a single employee, absolving guardians of their duty to watch their own children. If a parent is distracted or looks away, it is called an accident. If a lifeguard misses a silent drowning in a pool with glare and ripples, it is now being called a crime.
The Chilling Effect on First Responders
The implications of this case extend far beyond Zachary Stein and the specific pool where this occurred. This arrest has sent a wave of fear through the first responder and lifeguard communities.
Teenagers and young adults usually fill lifeguard positions. It is a job that requires long hours in the sun, intense focus, and the heavy burden of holding lives in your hands—often for minimum wage.
If a mistake or a delayed reaction can lead to a prison sentence and a permanent criminal record, who will want to take this job?
“He saved the boy,” said a former lifeguard in an interview regarding the case. “If I knew that saving a kid but doing it ‘too slow’ according to a camera would land me in jail, I’d be terrified to ever sit in that chair again.”
This is known as the “chilling effect.” By criminalizing the actions of a rescuer who successfully revived the victim, the legal system may inadvertently discourage people from entering the profession or taking action in emergencies for fear of legal retribution.
The Outcome
Following the incident and the subsequent legal firestorm, Zachary Stein resigned from his position. He could no longer work in an environment where his best efforts were deemed criminal.
The boy, Adam, made a recovery, though the long-term effects of the oxygen deprivation were a major concern for his family. The trauma of the event affects everyone involved.
As the case moves through the court system, it serves as a grim reminder of the litigious and punitive nature of modern society. The line between “accident” and “crime” is becoming increasingly blurred.
Stein’s defense maintains that this was a tragedy, not a crime. They argue that human error, specifically in the high-pressure environment of aquatic safety, should not be equated with malicious intent or criminal recklessness.
Conclusion: A Broken System?
The arrest of Zachary Stein forces us to confront uncomfortable questions about safety and blame.
There is no denying that a child nearly lost his life, and that is a tragedy that should never happen. But when we look for someone to blame, are we looking in the right direction? Is the 23-year-old who performed the CPR the villain? Or is he a scapegoat for a broader failure of supervision?
For now, a young man who dedicated his career to water safety faces the prospect of a criminal record, all because the camera saw what the human eye missed, and the law decided that imperfection was a crime.
What do you think? Was the lifeguard negligent, or are the parents to blame for not watching their child? Should a rescuer be arrested if the victim survives?